College Insight makes it possible for you to explore U.S. Financial Aid and Higher Education data across several data sources. Which mode of exploration do you need help with?
College Spotlight
College Spotlight allows you to look at data about a specific college, and then compare it to state, national, or even another college’s data.
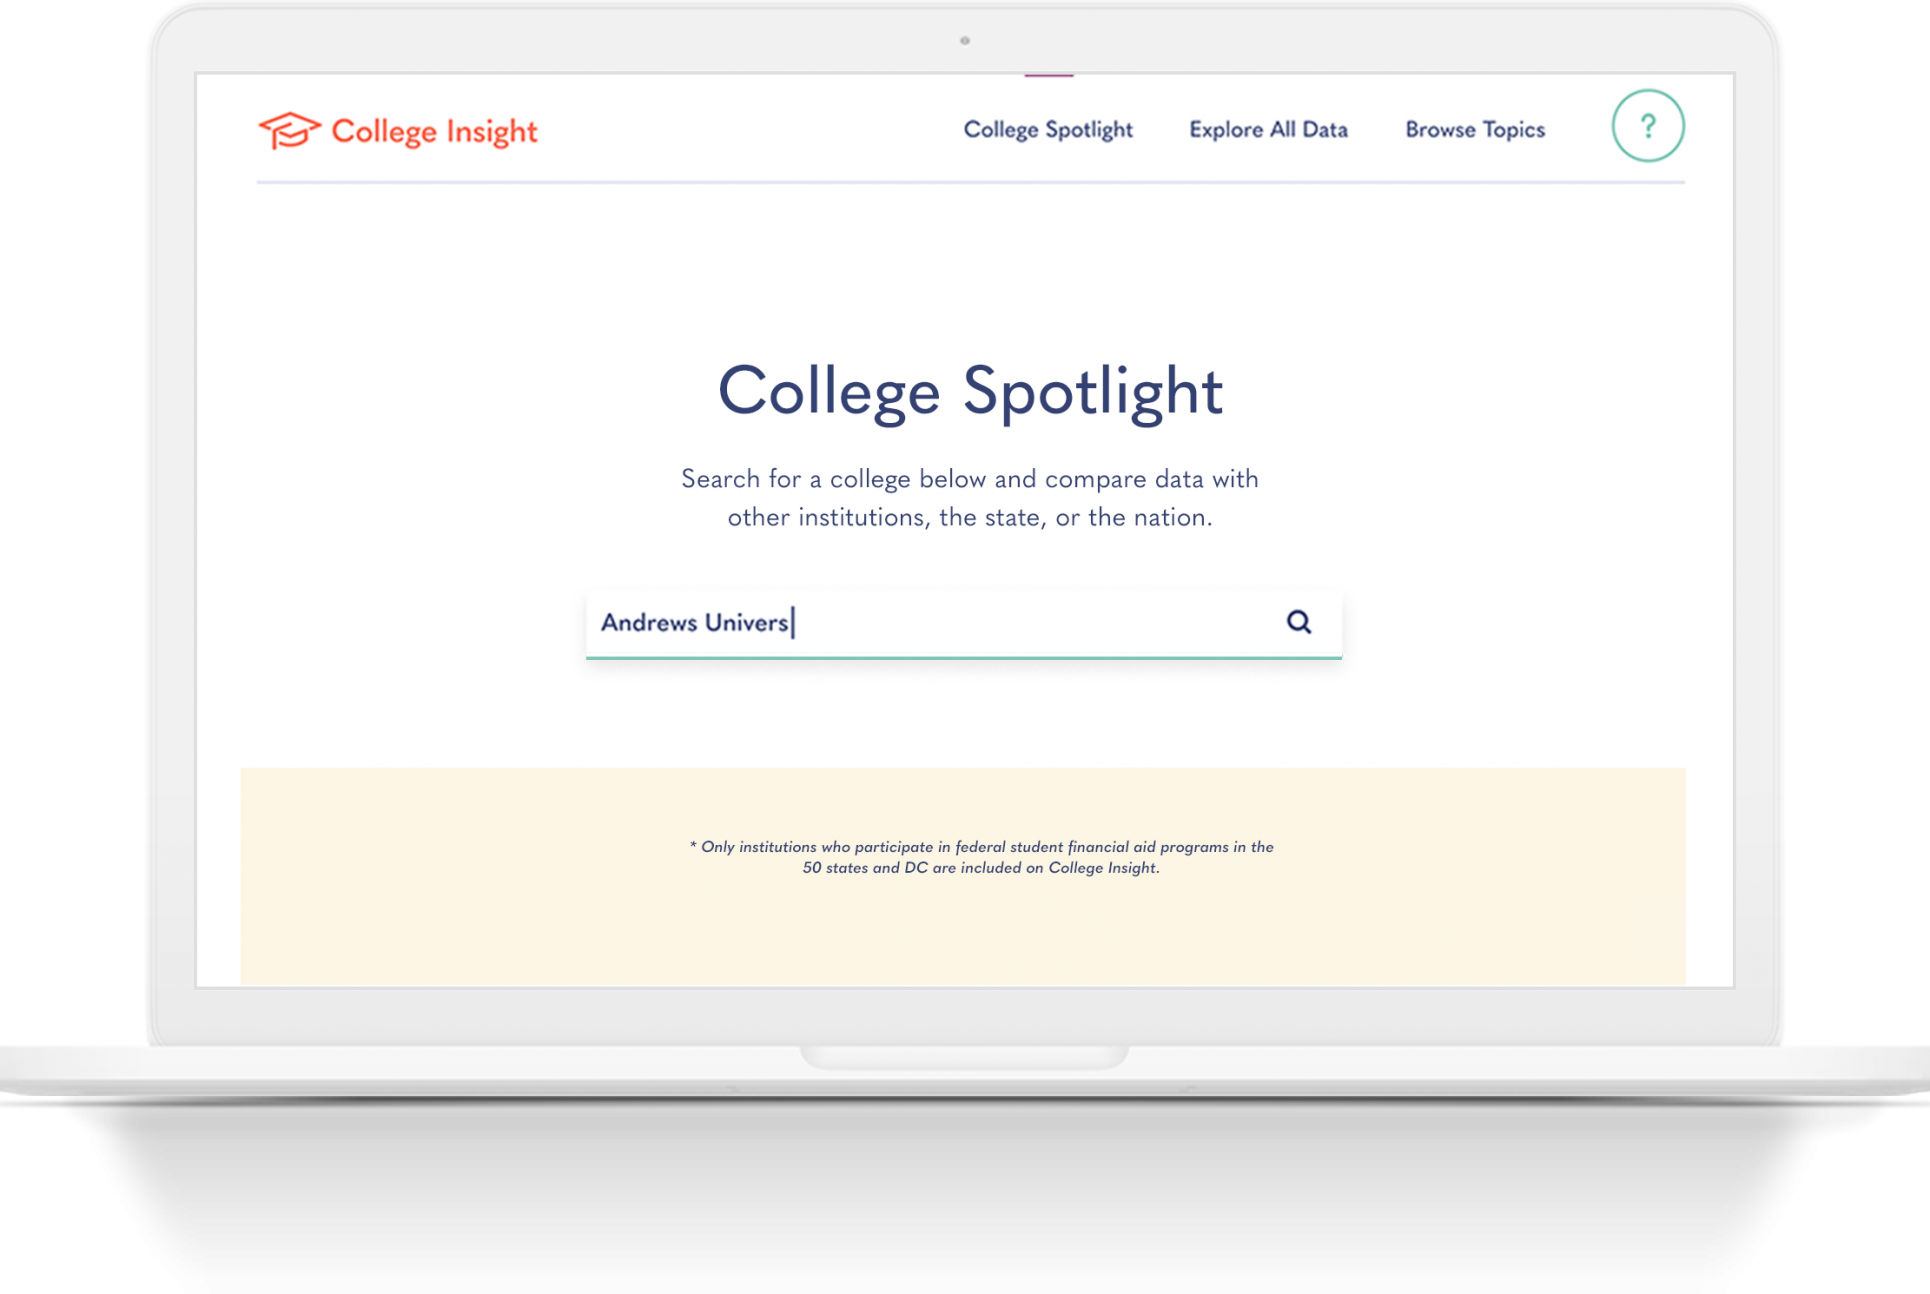
Step 1: Search for a College
You may click the search field and begin typing to see all relevant colleges.
Step 2: Add a Comparison
You can select several types of comparisons.
- 1. Default Comparison: This is one that we have selected that makes sense depending on the college that you originally selected.
- 2. State: This will compare your selected college to all others in the same state. Please note that this comparison will only include similar colleges. So if, for example, your initial college is a public college, 4 years and above, the state data will only show public colleges, 4 years and above.
- 3. National: Similar to state, but the entire U.S. Remember, if you select this comparison it will include the same settings as your initial search. So, for example, if your initial search is a private non-profit, this comparison will only show national data for private non-profits.
- 4. Another College: You can compare two colleges to each other even if they do not share characteristics like “public” vs “private non-profit.” Simply search for your comparison college.
Step 3: Explore, Share, or Export
Once you have the profiles you want, you can explore the data by expanding the many data tables on the page, opening charts and graphs, and even downloading a CSV version of the data you’re looking at to review in your own tools.
Explore All Data
Our most robust, and flexible option. You can create your own custom table using any combination of colleges, variables, or years as well as various levels of aggregation like by state or nationally.
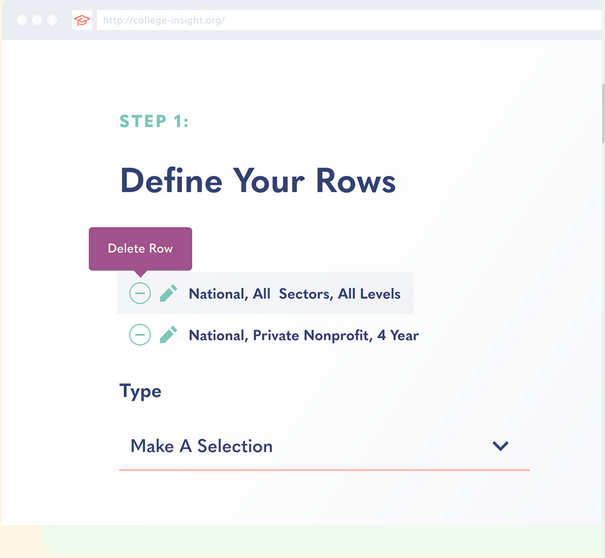
Step 1: Define Your Rows
You’ll begin by defining, at the highest level, what you’d like to include in your search. Later on, you’ll specify years and variables.
You have three types of searches available to you.
- 1. National: This type of search will allow you to see data across the U.S., which you can then narrow down by sector like “public” and level like “four or more years.” If you are looking for the most general search, try doing National, All Sectors, All Levels.
- 2. State: Similar to National in that you will be seeing aggregated data, state gives you the option to narrow in on a particular state. You also have the option to specify Sector and Level, but if you’d rather see everything just leave those set to “All.”
- 3. Institution: You can add individual colleges to your table with this option. Since each college has an inherent Sector and Level, all you’ll need to do is search for your desired college.
Once you’ve defined your first row, click “Save this Row” and a new, blank row will reveal to start on your next one. If you do not wish to add any more rows, proceed to “Step 2”.
Step 2: Select Your Years
Once you’ve specified some parameters of your search, you’ll pick the years of data you’d like to see.
Please note that we are dependent on our data sources, which sometimes do not show data for certain years. For example, if a college no longer exists you may only find data for that college in earlier years.
Once you have selected you years, proceed to “Step 3.” You can always edit these later if you like.
Step 3: Set Variables
This is the fun step; picking from our giant library of variables to build out your table.
As soon as you land on Step 3, you should see the Variables library on the right-hand side of the page (on mobile, this will fill your entire screen).
To add variables, simply select them via the checkboxes and click “Update Variables”. Please note that variables will be added to your table in the order that you select them, but you can reorder them if you like.
Once you’ve begun to add variables, you can continue to tweak and edit your table in a variety of ways.
- 1. Edit Years: This option allows you to re-specify the years for data included in the table.
- 2. Edit Rows: This option allows you to update one of your searches—for example if you had specified National, All Sectors, All Levels, you could refine that row to only show National, Public, All Levels for more specific information.
- 3. Reorder Variables: If you have a desired order of variables, this option allows you to drag and drop them into your preferred order. Keep in mind that the variable at the top will be furthest to the left on your table.
Step 4: Save, Export, or Share
Now that you have an awesome table, you can share a link to it on social media or via email as well as download a CSV version of it for your own use.
If you’d prefer to download our full data set, you can always find that option at the bottom of the page in this section.
Browse Topics
If you’re looking for a quick way to find data as well as all our most recent publications on a particular topic, this is the section for you!
Once you’ve picked your preferred topic, you have the following options;
Download Table
This will download a CSV version of the topic-specific table to your local computer.
Explore All Data
If you like what you’re seeing, but would like to make some tweaks or see other variables click this option to customize the table in Explore All Data.